Map #1: Map of Unprovoked Shark Attacks

| TERRITORY | TOTAL ATTACKS | FATAL ATTACKS | LAST FATALITY |
| USA (w/out Hawaii) | 921 | 39 | 2008 |
| Australia | 358 | 134 | 2008 |
| Africa | 278 | 70 | 2004 |
| Asia | 117 | 52 | 2000 |
| Pacific/Oceania Islands (w/out Hawaii) | 125 | 51 | 2007 |
| Hawaii | 111 | 11 | 2004 |
| South America | 100 | 23 | 2006 |
| Antilles & Bahamas | 65 | 17 | 1972 |
| Middle America | 65 | 33 | 2008 |
| New Zealand | 47 | 9 | 1968 |
| Europe | 39 | 18 | 1984 |
| Bermuda | 4 | 0 | |
| Unspecified | 21 | 7 | 1965 |
| WORLD | 2251 | 464 | 2008 |
This map was found on the Florida Museum of Natural History's webpage under the Ichthyology tab. This map displays data from all unprovoked shark attacks that occurred between 1580 to 2009. With the map there also comes a table which provides data as to the year when the last fatal shark attack occurred, how many attacks were fatal and how many total attacks occurred. Looking at the map we can tell that the United States (not including Hawaii) is home to the most shark attacks, second is Australia and third is Africa. With the map and table we can come up with certain statistics about shark attacks that occur in the world. According to this map and data, the last fatal shark attack occurred in 2008 and about 20.6 percent of shark attacks from 1580 to 2009 were fatal. I believe that this map is important because it can provide researchers and everyday people with important statistics about shark attacks. Furthermore, I find this map interesting because I am an avid ocean visitor. I spend most of my free time at the beach enjoying the majestic environment that mother nature has to offer. Yet, deep beneath the surface there are creatures of the unknown, creatures that humans have to co-exist with, respect and take caution towards. I also find this map interesting because in my opinion it represents a clear and accurate distribution of world shark attacks. The map is easy for the viewer to observe and provides a table to explain its findings.
Map can be found at: http://www.surfertoday.com/images/stories/sharkattackmap.jpg
Map #2: La Jolla Rough Water Swim Course
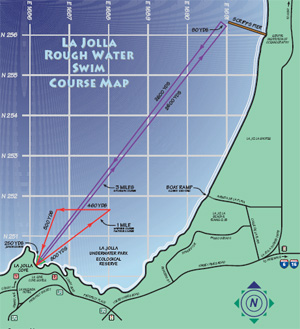
This is a map of the La Jolla Rough Water Swim Course. This is an open water swimming event that is gaining popularity each year that it is held. There are three different courses held in this venue: the one mile course, the Gatorman (a three mile swim out to Scripps Pier and back) and the 800 yard course for the junior division. This swim takes place in the beautiful and ecologically diverse La Jolla Cove, located in San Diego County. If one is lucky one will be able to see bright orange Garibaldi fish, the occassional leopard shark, schools of fish and an abundance of sea grass swaying beneath with the tides. In addition to the marine life one may also get a very close view of their opponent's feet kicking thunderously throughout the water. La Jolla Rough Water Swim has over 1,000 participants and thus the tiny cove comes alive with eager swimmers ranging from ages 8 and under to 65 and over. I chose this map as one of my interesting maps because this is an ocean swim that I have been competing in for the last 4 years. It is always a highlight of my summer and provides a decent mini vacation down to San Diego. I also chose this map because for me I found it quite interesting to see what the course looked like from an aerial/map view. In La Jolla Cove, all one can see are the balloon buoy markers reflecting the distance yet from this map one is able to get a better visual of the actual race.
Map can be found at: http://www.ljrws.com/Asset110.aspx?method=1
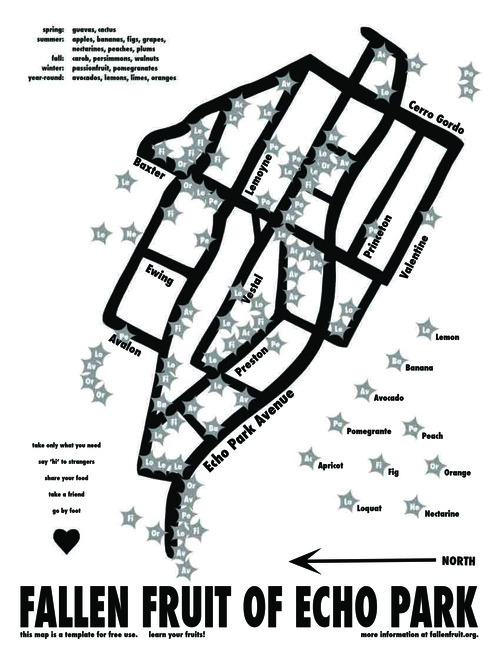
Map #3: Fallen Fruit of Echo Park
For my last interesting map, I chose a map of the "Fallen Fruit of Echo Park." In case you didn't know, Fallen Fruit is an organization that is based in certain cities all over the world but it is predominantly located in the United States. Locally there are 3 Fallen Fruit locations in Los Angeles including Venice Beach, Sherman Oaks and Echo Park. Fallen Fruit is an organization that creates art exhibits about local citizenship, neighborhood, community, and urban space in relation to fruit. This map, is a fruit map, which provides a map of all the fruit trees located in Echo Park that are participating in the program. Basically, these fruit trees are located in people's homes and are open to the public for picking. Fallen Fruit provides a sustainable practice so that uneaten fruit will not go bad and can be passed around the neighborhood for sharing. The variety of fruits range from season and place but as seen in the legend one will be able to find avocados, lemons and pomegranates in Echo Park just to name a few. I find this map interesting because I believe that the communal sharing of fruit trees leads to a more sustainable, closer knit community in which not only the fruit, but the people can grow. I myself have participated in using the Venice Beach Fallen Fruit map and have found it a very rewarding and fun experience.
Map can be found at: http://www.fallenfruit.org/wp-content/uploads/FallenFruitMap_EchoParkweb.pdf
No comments:
Post a Comment